|
Office 365 adds Business Intelligence tools
July 30, 2013 | Author: Adam Levine
While Apple makes its first steps with online office suites and learns how to draw simple diagrams, Microsoft has built business intelligence tools - Power BI - into its Office 365. This is quite useful thing, and not only for big companies but also for small business. It allows you to sort, group and organize large datasets, visualize them and create beautiful reports that will be updated when the data source is updated (data source is an Excel table). For example, you have a large table of orders loaded from your accounting system. With Power BI you can turn this large and unclear table into small and useful tables, for example: customers by industry, customers by city, sales by month, top customers by profit, etc. These little pieces of information will help you to understand who is your target audience and where your business is heading.
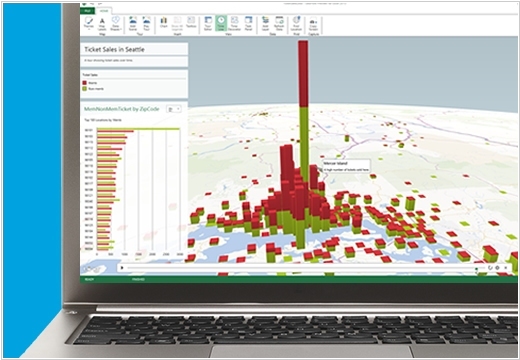
Of course, you can visualize these pieces of information into charts or even 3d-graphs on a map. Moreover, these data analytics can be done by anyone (director or marketing specialist), who have no clue how to build database queries. English-speaking users can even build data analytics in natural language - for example, enter "show our sales pipeline".
For now Power BI for Office 365 works in preview-mode. The commercial launch is scheduled for this fall.
See also: Top 10 Office suites