|
OpenNMS vs Prometheus
July 22, 2023 | Author: Michael Stromann
10
OpenNMS is a free and open-source enterprise grade network monitoring and network management platform.
24
An open-source monitoring system with a dimensional data model, flexible query language, efficient time series database and modern alerting approach.

See also:
Top 10 IT Monitoring software
Top 10 IT Monitoring software
OpenNMS and Prometheus are two distinct open-source tools used for monitoring and managing IT infrastructures, each with its own strengths. OpenNMS is a comprehensive network monitoring and management platform that provides a wide array of features for monitoring network devices, applications, and services. It excels in scalability, fault management, and event correlation, making it well-suited for large and complex networks. On the other hand, Prometheus is a specialized monitoring and alerting toolkit designed for time-series data collection and analysis, specifically tailored for dynamic, cloud-native environments. It focuses on monitoring metrics from various components and services, enabling in-depth insights and alerting based on specific thresholds.
See also: Top 10 IT Monitoring software
See also: Top 10 IT Monitoring software
OpenNMS vs Prometheus in our news:
2019. Zabbix 4.2 adds built-in support of Prometheus data collection
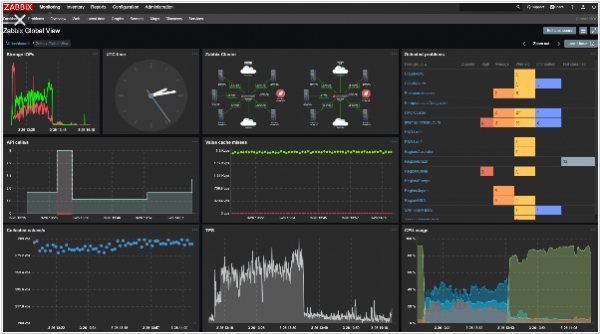
Zabbix Team has recently unveiled the launch of Zabbix 4.2. This latest version introduces a comprehensive monitoring system equipped with cutting-edge features, including data collection and processing, distributed monitoring, real-time problem and anomaly detection, alerting and escalations, visualization, and more. Zabbix 4.2 significantly enhances data collection capabilities, supporting diverse methods such as push and pull from various sources like JMX, SNMP, WMI, HTTP/HTTPS, RestAPI, XML Soap, SSH, Telnet, agents, scripts, and more. Notably, the integration with Prometheus has been added as a new feature, allowing native support for the PromQL language. Additionally, the utilization of dependent metrics empowers the Zabbix team to efficiently gather a vast amount of Prometheus metrics. By making a single HTTP call, all the required data can be retrieved and subsequently reused for relevant dependent metrics.