|
Kibana vs dynaTrace
July 27, 2023 | Author: Michael Stromann
20
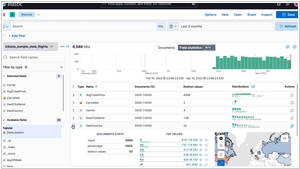
Kibana is a source-available data visualization dashboard software for Elasticsearch, whose free and open source fork in OpenSearch is OpenSearch Dashboards. Powerful analysis on any data from any source, from threat intelligence to search analytics, logs to application monitoring, and much more.
20
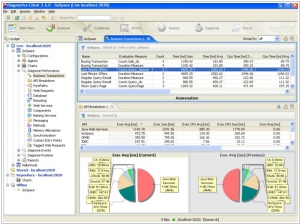
Cloud monitoring reinvented. Easy, Automatic, AI-Powered. Automatically monitor dynamic hybrid-cloud environments.
Kibana and dynaTrace are two distinct tools that cater to different aspects of IT and software monitoring and analysis. Kibana, part of the Elastic Stack, is primarily a data visualization and exploration tool that works in conjunction with Elasticsearch. It specializes in log management and analytics, providing users with powerful visualization capabilities, interactive dashboards, and search functionalities. Kibana is commonly used for log analysis, monitoring application performance, and gaining insights from various time-series data. It is well-suited for IT teams and developers seeking to understand system behavior and troubleshoot issues within a comprehensive log management ecosystem.
In contrast, dynaTrace, now known as Dynatrace, is a full-fledged application performance monitoring (APM) solution. It goes beyond log analysis and focuses on monitoring the performance of complex software applications in real-time. Dynatrace offers end-to-end visibility into application ecosystems, including servers, databases, microservices, and user interactions. Its AI-powered capabilities enable automatic root cause analysis, anomaly detection, and performance optimization recommendations. Dynatrace is commonly used by enterprises and organizations that require deep insights into application performance to ensure optimal user experiences and proactively address performance bottlenecks.
While both Kibana and dynaTrace can aid in monitoring and analysis, they have distinct areas of expertise and target different user needs. Kibana is more suitable for log analysis and general data visualization, while dynaTrace is a specialized APM solution designed to deliver comprehensive performance insights for complex application environments. The choice between Kibana and dynaTrace depends on the specific monitoring requirements and objectives of the organization, with Kibana catering to log and data analytics and dynaTrace focused on detailed application performance monitoring.
See also: Top 10 Business Intelligence software