|
Grafana vs dynaTrace
July 23, 2023 | Author: Michael Stromann
20
Cloud monitoring reinvented. Easy, Automatic, AI-Powered. Automatically monitor dynamic hybrid-cloud environments.

See also:
Top 10 IT Monitoring software
Top 10 IT Monitoring software
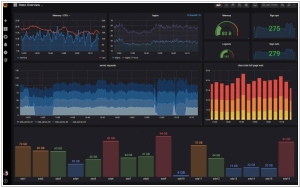
Grafana and Dynatrace are two powerful tools used for monitoring and observability, but they serve distinct purposes and have different capabilities. Grafana is primarily a data visualization platform that excels at creating customizable dashboards and charts from various data sources, including time-series databases, cloud services, and more. It is commonly used for real-time data monitoring and exploration, offering a user-friendly interface that allows users to visualize and analyze data efficiently. Grafana's strength lies in its flexibility and ability to integrate with a wide range of data sources, making it a popular choice for visualizing infrastructure metrics and logs.
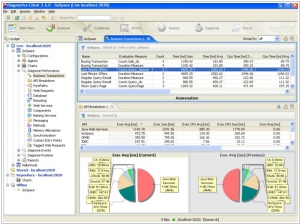
On the other hand, Dynatrace is a comprehensive application performance monitoring (APM) solution that focuses on monitoring and optimizing the performance of web applications and services. It provides deep insights into application code, server performance, user experience, and dependency mapping, enabling users to detect and diagnose performance bottlenecks and issues across complex environments. Dynatrace's strength lies in its AI-driven automation and advanced monitoring capabilities, which allow it to automatically detect anomalies and performance degradations, reducing the time needed for troubleshooting and resolution.
While both Grafana and Dynatrace offer monitoring capabilities, the key difference between them lies in their primary focus. Grafana is primarily a data visualization platform suited for visualizing infrastructure and time-series data, whereas Dynatrace is an APM tool designed to optimize application performance and user experience. The choice between Grafana and Dynatrace depends on the specific monitoring requirements and whether the emphasis is on infrastructure visualization or comprehensive application performance monitoring and optimization. In some cases, organizations may even use both tools in combination to get a holistic view of their entire infrastructure and applications.
See also: Top 10 IT Monitoring software