|
Grafana vs Librato
July 23, 2023 | Author: Michael Stromann
2
One platform, unlimited metrics. Monitoring Zen. We get your data flowing to us from anywhere, whether it's through our API, a turn-key solution, or one of our many open source collection agents. Turn your raw data into intuitive metrics with our powerful composite metric defi-nitions. Owned by SolarWinds.

See also:
Top 10 IT Monitoring software
Top 10 IT Monitoring software
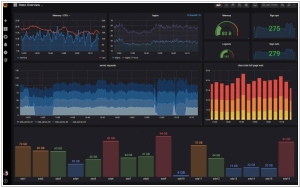
Grafana and Librato are both tools used for monitoring and data visualization, but they have significant differences in terms of their focus and capabilities. Grafana is primarily a data visualization platform that excels at creating dynamic and customizable dashboards from various data sources, including time-series databases, cloud services, and more. It is commonly used for real-time data monitoring and exploration, offering a user-friendly interface that allows users to visualize and analyze data efficiently. Grafana's strength lies in its flexibility and ability to integrate with a wide range of data sources, making it a popular choice for visualizing infrastructure metrics and logs.
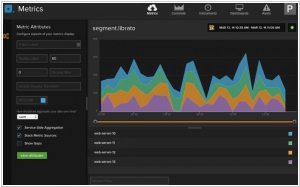
On the other hand, Librato is a cloud-based monitoring and metrics platform that specializes in collecting, storing, and analyzing time-series data. It provides a scalable solution for tracking and visualizing performance metrics and KPIs from various systems and applications. Librato offers a robust set of features, including alerting, anomaly detection, and metric aggregation, making it a comprehensive choice for organizations seeking a cloud-based solution for monitoring their infrastructure and applications.
Another key difference between Grafana and Librato lies in their deployment options. Grafana is typically installed and hosted on-premises or in the cloud, allowing users to have full control over their data and infrastructure. On the other hand, Librato is a cloud-native solution, meaning it is fully hosted and managed by the service provider, freeing users from the burden of maintaining the infrastructure. This makes Librato an attractive option for organizations looking for a hassle-free and scalable cloud-based monitoring solution. The choice between Grafana and Librato depends on specific monitoring needs, data storage preferences, and the desire for on-premises or cloud-based deployment.
See also: Top 10 IT Monitoring software