|
Grafana vs Kibana
July 27, 2023 | Author: Michael Stromann
20
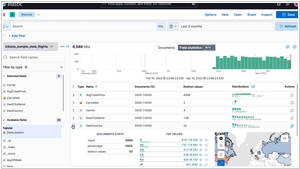
Kibana is a source-available data visualization dashboard software for Elasticsearch, whose free and open source fork in OpenSearch is OpenSearch Dashboards. Powerful analysis on any data from any source, from threat intelligence to search analytics, logs to application monitoring, and much more.
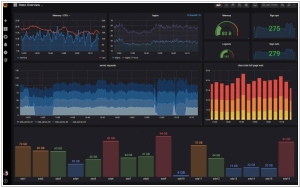
Grafana and Kibana are two widely used data visualization tools, each specializing in different areas of data monitoring and analysis. Grafana is an open-source platform primarily designed for time-series data visualization and monitoring. It excels in creating dynamic and interactive dashboards, making it a popular choice for monitoring metrics and performance data from various sources such as Prometheus, InfluxDB, and Graphite. Grafana's focus on time-series data makes it particularly well-suited for visualizing trends, anomalies, and performance metrics over time.
On the other hand, Kibana, as part of the Elastic Stack, is an open-source data visualization platform that is more versatile in handling diverse data types beyond time-series data. It specializes in real-time data exploration and analysis, making it ideal for log analysis, text-based data, and structured data from Elasticsearch. Kibana's strength lies in creating complex visualizations and dashboards for a wide range of use cases, including log monitoring, application performance analysis, and security analytics.
Another key difference between Grafana and Kibana is their respective ecosystems and integrations. Grafana is tightly integrated with various time-series databases and data sources, making it the go-to choice for organizations primarily dealing with time-series data and monitoring. In contrast, Kibana's integration with the Elastic Stack, including Elasticsearch, Logstash, and Beats, enables a powerful end-to-end data analysis solution for those using the Elastic Stack as their data infrastructure.
See also: Top 10 Business Intelligence software