|
Grafana vs Icinga
July 23, 2023 | Author: Michael Stromann

See also:
Top 10 IT Monitoring software
Top 10 IT Monitoring software
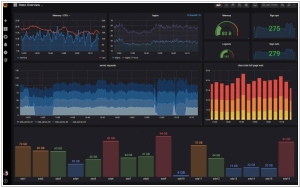
Grafana and Icinga are both widely used tools in the realm of monitoring and observability, but they serve different purposes and have distinct features. Grafana is primarily a data visualization platform that excels at creating dynamic and customizable dashboards from various data sources, including time-series databases, cloud services, and more. It is commonly used for real-time data monitoring and exploration, offering a user-friendly interface that allows users to visualize and analyze data efficiently. Grafana's strength lies in its flexibility and ability to integrate with a wide range of data sources, making it a popular choice for visualizing infrastructure metrics and logs.
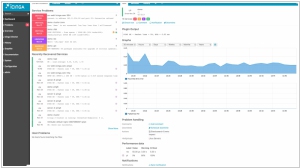
In contrast, Icinga is a comprehensive open-source monitoring system that focuses on proactive monitoring of IT infrastructure and network services. It is designed to continuously monitor the health and availability of hosts and services, alerting administrators about potential issues and anomalies. Icinga's robust feature set includes support for monitoring checks, notifications, and reporting, making it well-suited for larger-scale, complex environments. While Grafana excels at data visualization and real-time monitoring, Icinga is geared towards providing a comprehensive monitoring solution with an emphasis on infrastructure health and availability.
Another key difference between Grafana and Icinga lies in their architecture and integration capabilities. Grafana is primarily a frontend tool that connects to various data sources to visualize the collected data. It can work with a wide range of data storage systems, making it easy to create unified dashboards with data from different sources. On the other hand, Icinga is a standalone monitoring system that relies on agents or plugins to collect data from hosts and services. It offers native integrations with various monitoring plugins and third-party tools to enhance its functionality, providing users with a comprehensive monitoring solution tailored to their specific needs. The choice between Grafana and Icinga largely depends on whether the focus is on data visualization and real-time monitoring (Grafana) or comprehensive infrastructure monitoring and alerting (Icinga). In some cases, organizations may even use both tools in combination to get a complete view of their monitoring landscape.
See also: Top 10 IT Monitoring software