|
Grafana vs Graphite
July 23, 2023 | Author: Michael Stromann
4
Graphite is an enterprise-ready monitoring tool that runs equally well on cheap hardware or Cloud infrastructure. Teams use Graphite to track the performance of their websites, applications, business services, and networked servers. It marked the start of a new generation of monitoring tools, making it easier than ever to store, retrieve, share, and visualize time-series data.

See also:
Top 10 IT Monitoring software
Top 10 IT Monitoring software
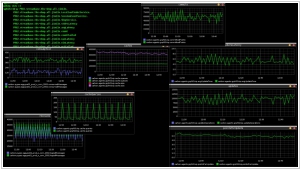
Grafana and Graphite are both widely used tools in the realm of monitoring and data visualization, but they serve different purposes and have distinct features. Graphite is primarily a time-series database and monitoring tool, focused on collecting, storing, and retrieving time-series data, often obtained from metrics and performance data of various systems. It excels at efficiently handling large volumes of time-series data and provides basic graphing capabilities. However, Graphite lacks advanced visualization features and dashboard creation options, which makes it more suitable for organizations primarily focused on time-series data storage and basic graphing needs.
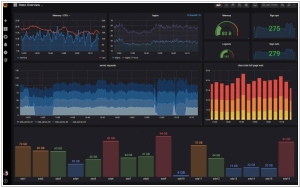
On the other hand, Grafana is a full-fledged data visualization and dashboarding platform that supports integration with various data sources, including Graphite. While Grafana can also visualize time-series data, it goes beyond basic graphing and offers a wide array of visualization options, including histograms, heatmaps, and gauge visualizations. Its user-friendly interface and rich set of plugins and integrations make it a powerful tool for creating dynamic and customizable dashboards, enabling users to gain deeper insights into their data.
Another key difference between Grafana and Graphite lies in their scope and usage. Graphite is primarily a backend tool, focused on data storage and retrieval, while Grafana is more of a frontend visualization tool that connects to multiple data sources, making it easier to create unified dashboards with data from various sources, not just limited to time-series databases like Graphite. Therefore, Grafana is often used in conjunction with Graphite or other databases, allowing users to leverage the strengths of each tool to create comprehensive and visually appealing monitoring solutions tailored to their specific needs.
See also: Top 10 IT Monitoring software