|
ELK vs Nagios
July 23, 2023 | Author: Michael Stromann
13
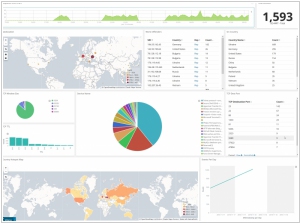
ELK is the acronym for three open source projects: Elasticsearch, Logstash, and Kibana. Elasticsearch is a search and analytics engine. Logstash is a server‑side data processing pipeline that ingests data from multiple sources simultaneously, transforms it, and then sends it to a "stash" like Elasticsearch. Kibana lets users visualize data with charts and graphs in Elasticsearch.
21
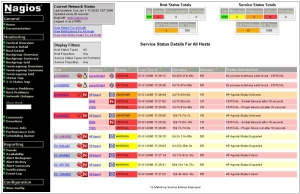
Nagios Is The Industry Standard In IT Infrastructure Monitoring. Achieve instant awareness of IT infrastructure problems, so downtime doesn't adversely affect your business. Nagios offers complete monitoring and alerting for servers, switches, applications, and services.

See also:
Top 10 IT Monitoring software
Top 10 IT Monitoring software
ELK (Elasticsearch, Logstash, Kibana) and Nagios are two distinct tools serving different purposes in the realm of monitoring and observability. ELK is a powerful stack used for log management and data analysis. It combines Elasticsearch for data storage and search, Logstash for data processing and parsing, and Kibana for data visualization and analysis. ELK excels at centralizing and analyzing log data from various sources, making it ideal for troubleshooting, debugging, and security analysis. On the other hand, Nagios is a comprehensive monitoring system designed for proactive monitoring of IT infrastructure and network services. It focuses on continuously monitoring the health and availability of hosts and services, providing alerting capabilities to notify administrators about potential issues and anomalies. While ELK is more tailored towards log management and analysis, Nagios is specialized in infrastructure monitoring, making it a preferred choice for organizations seeking to ensure the reliability and performance of their IT systems.
See also: Top 10 IT Monitoring software
See also: Top 10 IT Monitoring software
ELK vs Nagios in our news:
2014. Nagios launched log management solution
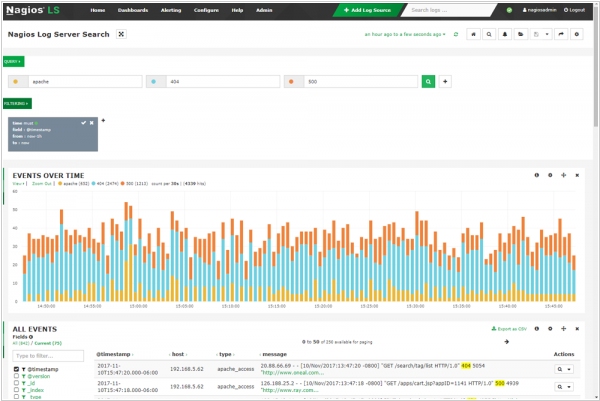
Nagios has introduced Nagios Log Server, a robust enterprise-level solution for monitoring and managing logs. This innovative offering empowers organizations to effortlessly view, sort, and configure logs from any source within their network. By augmenting Nagios' existing network management solutions, Log Server equips users with the capability to thoroughly analyze network events, logs, and performance benchmarks. The introduction of Nagios Log Server simplifies the management of network log data, enabling users to swiftly set up monitoring for their logs using configuration wizards. With a centralized dashboard and user-friendly management interface, Log Server facilitates seamless oversight and detailed examination of infrastructure issues, network errors, and log events.