|
ELK vs Grafana
July 23, 2023 | Author: Michael Stromann
13
ELK is the acronym for three open source projects: Elasticsearch, Logstash, and Kibana. Elasticsearch is a search and analytics engine. Logstash is a server‑side data processing pipeline that ingests data from multiple sources simultaneously, transforms it, and then sends it to a "stash" like Elasticsearch. Kibana lets users visualize data with charts and graphs in Elasticsearch.

See also:
Top 10 IT Monitoring software
Top 10 IT Monitoring software
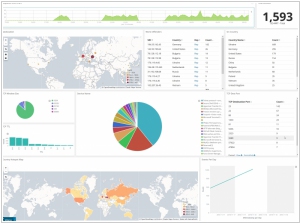
ELK (Elasticsearch, Logstash, Kibana) and Grafana are both powerful tools used for monitoring, data visualization, and log management, but they have significant differences in their architecture and use cases. ELK is a comprehensive stack that combines Elasticsearch for data storage and search, Logstash for data processing and parsing, and Kibana for data visualization and analysis. It is primarily used for log management and log analysis, enabling organizations to centralize and analyze logs from various sources for troubleshooting, debugging, and security purposes. ELK's strength lies in its ability to handle large volumes of log data efficiently and its powerful search capabilities, making it ideal for log-centric monitoring and analysis.
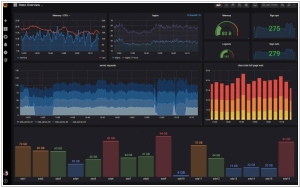
Grafana, on the other hand, is a data visualization platform that excels at creating dynamic and customizable dashboards from various data sources, including time-series databases, cloud services, and more. While it can be used to visualize log data through integrations with logging tools like Elasticsearch, its primary focus is on creating visually appealing charts and graphs for real-time data monitoring and exploration. Grafana's strength lies in its flexibility and ability to integrate with a wide range of data sources, making it a popular choice for visualizing infrastructure metrics, application performance data, and other time-series data.
Another key difference between ELK and Grafana lies in their architecture and components. ELK is a stack that requires the installation and configuration of multiple components (Elasticsearch, Logstash, and Kibana) to function together as a log management solution. Grafana, on the other hand, is a standalone tool that can be installed and used independently, or it can be integrated with various data sources and databases to create comprehensive dashboards and visualizations. This difference in architecture makes ELK more focused on log management and analysis, while Grafana is more versatile and can be used for a broader range of monitoring and visualization needs. The choice between ELK and Grafana depends on specific use cases and requirements, with ELK being a go-to choice for log-centric analysis, and Grafana excelling in data visualization and real-time monitoring scenarios.
See also: Top 10 IT Monitoring software