|
Diagrams.net vs LucidChart
September 21, 2023 | Author: Adam Levine
15
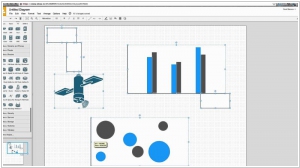
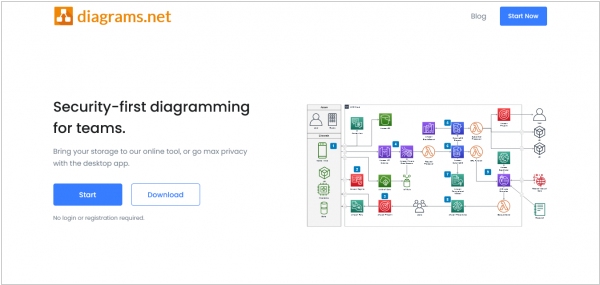
Diagrams.net (former Draw.io) is a free online diagram drawing application for workflow, BPM, org charts, UML, ER, network diagrams. It provides its user fast, easy and free way to create simple diagrams without the need to install anything on their computer.
28
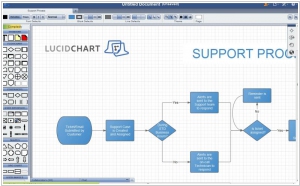
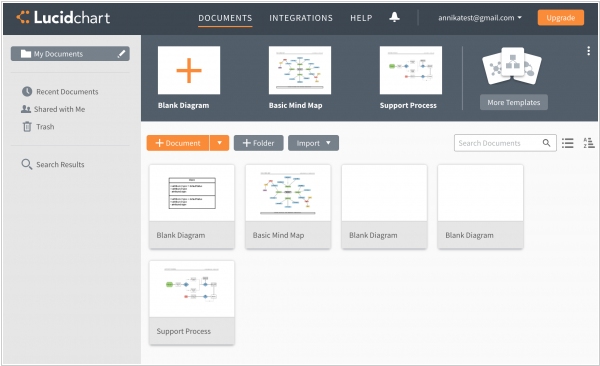
Lucidchart is the intelligent diagramming application that brings teams together to make better decisions and build the future. Flow charts, diagrams, UML sketches, and ER models have never been easier. We've redesigned the entire diagramming process to make it as easy as possible. Make flow charts, wireframes, mind maps, and org charts.
Diagrams.net (formerly known as Draw.io) and LucidChart are both popular online diagramming tools, but they have distinct features and approaches to visualizing and creating diagrams. Diagrams.net is an open-source diagramming software that offers a wide range of diagram types, including flowcharts, network diagrams, UML diagrams, and more. It provides a user-friendly interface with a drag-and-drop functionality, allowing users to quickly create and customize diagrams. Diagrams.net is known for its simplicity and versatility, offering robust diagramming capabilities without the need for a paid subscription. On the other hand, LucidChart is a feature-rich diagramming platform that focuses on collaboration and advanced diagramming functionality. It offers a wide array of templates, shapes, and integrations with other productivity tools. LucidChart's real-time collaboration features make it suitable for teams working on complex projects.
See also: Top 10 Diagramming software
See also: Top 10 Diagramming software
Diagrams.net vs LucidChart in our news:
2020. Draw.io's open source diagramming is moving to diagrams.net
The widely used open-source diagramming web application, Draw.io, is undergoing a domain name transition, shifting away from its well-known .io domain to Diagrams.net. This change is motivated by the need to enhance security and uphold ethical practices. The decision to migrate stems from a security issue associated with .io top-level domains, compounded by a lack of communication from the domain administrator in addressing the matter. The absence of communication has eroded the trust of the diagrams.net development team in the .io TLD administrator. The transition process from Draw.io to diagrams.net will be gradual and extend throughout the entire year of 2020. During this transition period, the Draw.io domain will continue to host the diagramming web application without any redirections until the migration is fully completed.
2018. LucidChart raises $72 million to grow the web-based diagramming software
Web-based visual design platform Lucid Software has successfully secured $72 million in funding through a recent investment round. Established in 2010, Lucid Software is renowned for its flagship product, Lucidchart, which resembles Microsoft Visio and functions as a collaborative diagramming application for wireframing, UI prototyping, and various similar applications. Users ranging from freelancers to students can utilize this software to create a wide array of visuals, including organizational HR charts. Noteworthy competitors of Lucidchart include tools developed by Adobe and Microsoft Visio, while other prominent players in the field encompass SmartDraw, Gliffy, and the open-source Draw.io. Lucidchart aims to distinguish itself by offering a seamless user experience, compatibility across multiple devices and platforms, real-time collaboration, and advanced functionality such as automated diagrams and integration with external data sources.
2018. draw.io allows to automatically create diagrams from CSV files

Various departments and professionals within companies often deal with data presented in tables or spreadsheets, and converting that data into diagrams can enhance comprehension. Importing data into draw.io for visual representation is now a straightforward process. In this format, each row corresponds to a shape, while the columns contain the respective data for those shapes. It is important to note that not all columns are used as data within the diagram; some serve as instructions for shape formatting or act as identifiers for drawing connectors between shapes. Additionally, draw.io allows you to customize the formatting of the shapes according to your preferences.
2017. draw.io is now available as a Trello Power-Up
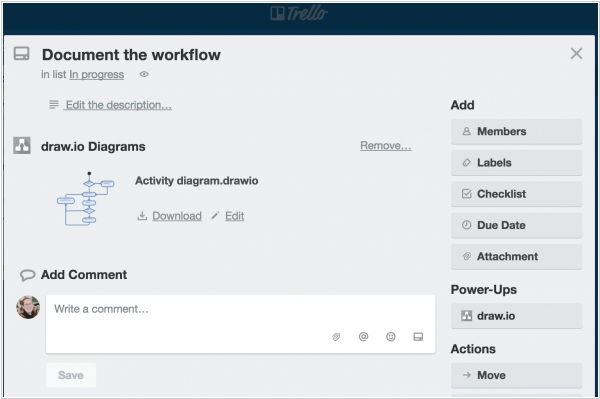
Now, keeping related draw.io diagrams alongside Trello tasks has become significantly easier. Instead of relying on shared folders, cloud file services, or cumbersome email exchanges, you can now embed one or multiple diagrams directly into any Trello card. This seamless integration allows for more efficient collaboration with your team. With draw.io, you have the flexibility to create various types of diagrams, including flowcharts, BPMN diagrams, mockups, wireframes, UML and ER diagrams, floor plans, electrical circuits, infographics, and more. The platform offers an extensive shape library, robust tools for importing diagrams in different formats, and securely stores all data within Trello.