|
Cacti vs Grafana
July 23, 2023 | Author: Michael Stromann
10
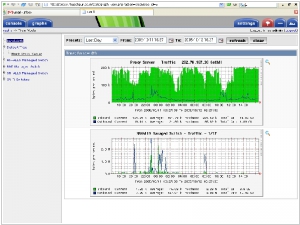
Cacti is an open-source, web-based network monitoring and graphing tool designed as a front-end application for the open-source, industry-standard data logging tool RRDtool. Cacti allows a user to poll services at predetermined intervals and graph the resulting data.

See also:
Top 10 IT Monitoring software
Top 10 IT Monitoring software
Cacti and Grafana are both popular tools used for monitoring and data visualization, but they have significant differences in terms of their architecture and capabilities. Cacti is primarily a network graphing solution that focuses on monitoring and graphing data related to network devices and interfaces. It utilizes SNMP (Simple Network Management Protocol) to collect data and create graphs, making it a suitable choice for network administrators seeking to monitor and analyze network performance metrics. Cacti's strength lies in its historical graphing capabilities and support for traditional network devices, making it well-suited for network-centric monitoring scenarios.
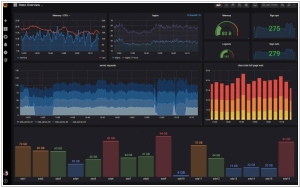
On the other hand, Grafana is a more versatile data visualization platform that supports integration with various data sources, making it a popular choice for visualizing metrics and performance data from diverse systems and applications. It can connect to databases, cloud services, time-series databases like Prometheus, and many other data storage systems. Grafana's primary focus is on creating dynamic and customizable dashboards, enabling users to explore real-time data and create visually appealing charts and graphs. Its flexibility and ability to integrate with a wide range of data sources make it a powerful tool for monitoring and analyzing not only network-related data but also infrastructure, application, and business metrics.
Another key difference between Cacti and Grafana lies in their user interfaces and ease of use. Cacti offers a more traditional and static web interface, while Grafana's interface is more modern, interactive, and user-friendly. Grafana's intuitive dashboard creation and templating options make it easier for users to design visually appealing and interactive dashboards without extensive technical knowledge. In contrast, Cacti may require more configuration and manual setup to achieve similar visualization and customization levels. The choice between Cacti and Grafana depends on specific monitoring requirements, with Cacti being well-suited for network-centric monitoring, and Grafana being a more flexible choice for multi-dimensional monitoring and visualization needs.
See also: Top 10 IT Monitoring software